
Three colors, three frequency balances
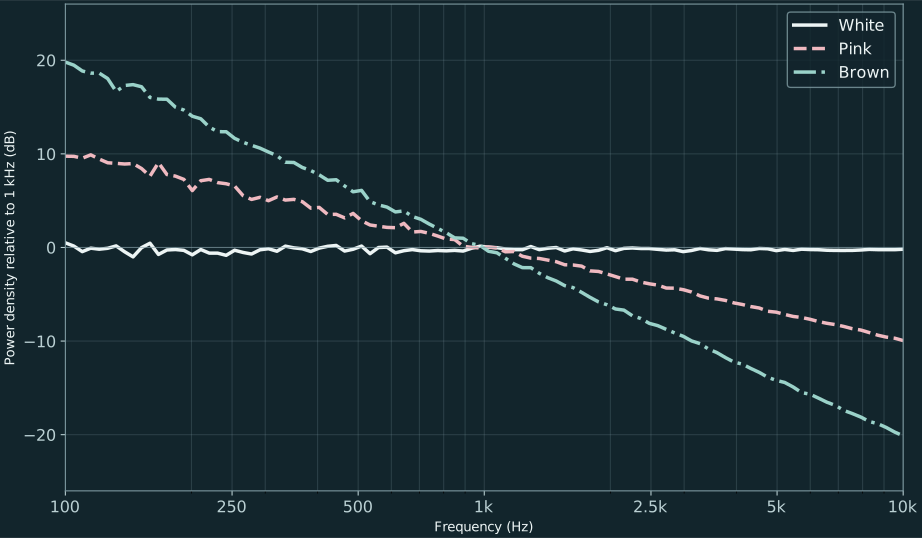
White noise has a flat power density. Pink has roughly equal power per octave. Brown has a stronger low-frequency emphasis. “White”, “pink” and “brown” describe signal spectra; they do not rank the sounds by usefulness.
Listen with the buttons above. White tends to sound brighter, pink softer and brown deeper. The sound reaching you also depends on the speakers, room and volume.
Make a useful A/B comparison
Start at a comfortable level and use the same equipment for each color. Listen briefly, switch, and notice whether brightness, bass or a recurring sound draws your attention. Reduce Volume if a switch sounds stronger.
The files share the same maximum sample level, but may sound different in loudness. Each curve in the graph is set to 0 dB at 1 kHz, so the graph compares frequency balance rather than playback volume.
Choose a sound for your situation
For a background while reading, compare the colors using the same short task. For bedtime, compare them in your room before settling down. If a noise color feels intrusive, try a natural recording or silence.
All three examples are 10-second prepared loops generated for AmbientBlend. They do not demonstrate that any color treats a health condition or improves sleep or attention.
Measured here
What is in the files?
These curves come from the three audio loops in this player. Each curve is set to 0 dB at 1 kHz so you can compare its shape. This is a frequency comparison, not a loudness ranking.

| Noise | dB per octave | Loop |
|---|---|---|
| White | 0.00 | 10 s |
| Pink | -3.03 | 10 s |
| Brown | -6.05 | 10 s |
How we measured this
We analyzed the delivered mono WAV files at 48 kHz with a Welch power-spectrum estimate: 16,384-sample Hann windows with a hop of 8,192 samples. Each point averages linear power density in a 1/12-octave band. The slope is a line fitted against log₂ frequency between 100 Hz and 10 kHz. These finite loops vary slightly from ideal mathematical spectra.
Know what you are hearing
Recordings & sources
The player repeats the short audio files below for as long as your session runs. The loop length is the length of each file, not a limit on listening time. Events within a recording may repeat.
| Sound | Loop | Source |
|---|---|---|
| White noise | 10 s Mono | Generated by AmbientBlend Original synthetic noise |
| Pink noise | 10 s Mono | Generated by AmbientBlend Original synthetic noise |
| Brown noise | 10 s Mono | Generated by AmbientBlend Original synthetic noise |
Start at a comfortable level. The volume percentages describe player settings; they do not measure the sound level at your ears. Playback with a locked screen or a background tab depends on your device and browser. Opening another page stops playback.
Further reading
Common questions
How do white, pink and brown noise differ?
White spreads power evenly per unit of frequency; pink reduces power density with increasing frequency; brown emphasizes low frequencies more strongly. Use the player and measured chart to compare the examples, rather than choosing by the color name alone.
Why does the graph not show which sound is loudest?
Each spectrum is normalized at 1 kHz to make its shape comparable. Playback loudness is a different measurement, and the same slider position need not sound equally loud for each color.
Which one should I use to block distracting noise?
Try a texture you can keep at a comfortable level and compare whether the distraction is less noticeable. Sound masking adds sound; it does not remove sound from the room or cancel noise electronically.